Peering Into the Hearts of Galaxy Clusters
Relevant Works: Connor et al. 2017; Connor et al. 2019a
If you want to study the evolution of galaxies, it's tough to beat galaxy clusters. Not only are there significantly more galaxies to study in a given area of the sky (compared to the field), but there are so many parameters to vary that one dataset can be used for many kinds of science. The problem is that clusters are crowded environments, so it is a challenging task to isolate light from one specfic galaxy. And, unlike star clusters, these galaxies are extended structures, so even with larger telescopes and greater resolution, these challenges will remain.
The Cluster Lensing and Supernova survey with Hubble ( CLASH, Postman et al., 2012) was a survey with the Hubble Space Telescope that observed 25 galaxy clusters, 0.2 ≤ z ≤ 0.9, with 16 filters, from the UV to the IR. The dataset, especially when combined with supplemental observations from ground-based facilities and at multiple wavelengths, is one of the best available for studying galaxy clusters. However, the default data products were not good enough to study the populations of cluster galaxies. In addition to detection catalogs that didn't prioritize cluster science, the photometry was not intelligently handling overlapping light profiles from galaxies. For those of us who wanted to use the CLASH data to study galaxies, something needed to be done.
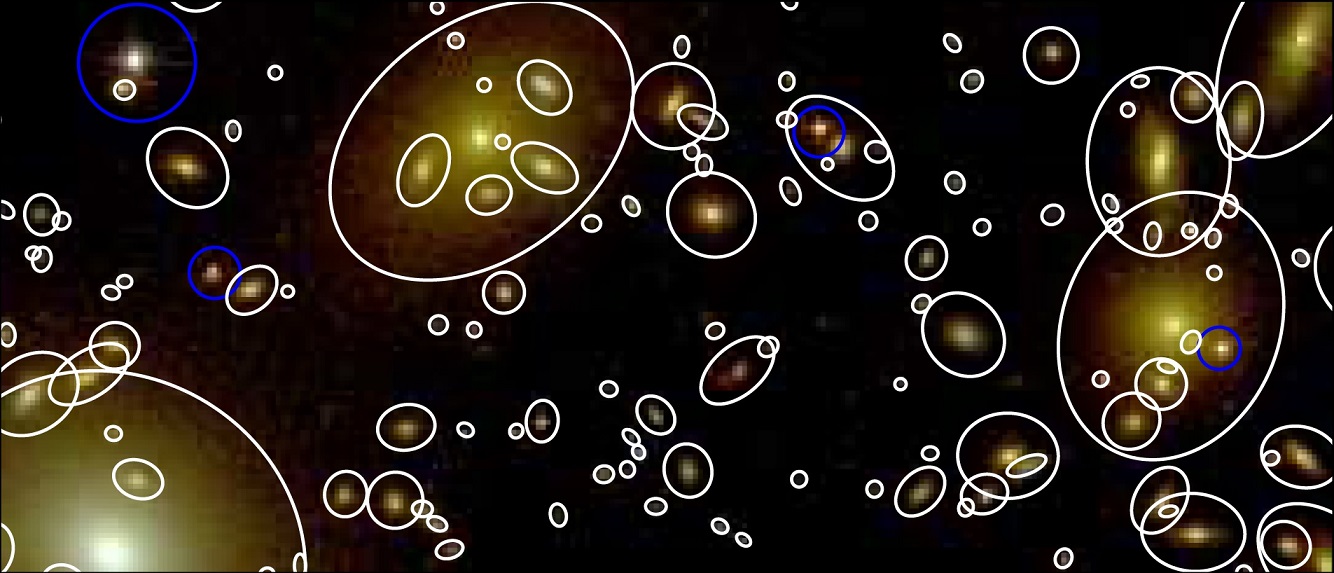
First is the challenge of getting a detection catalog that finds what you want. The default catalog broke small galaxies apart to try to find lensed galaxies. Being less aggressive with source separation led to grouping nearby small galaxies together. The Source Extractor by itself was not going to solve this problem, so we came up with a new technique. Each galaxy exists in a background of light; for small galaxies, that background might be the larger galaxies that are spatially coincident. By subtracting a scale-appropriate background, we could generate images where small galaxies could be seen independent of their larger neighbors. By generating multiple images, each with their own background scale, we could detect large and small galaxies from the same image.
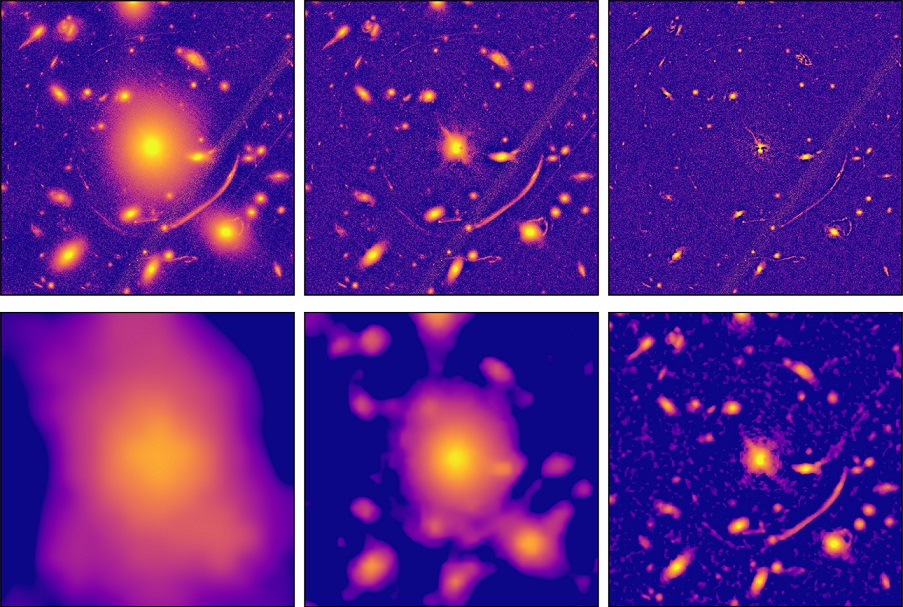 An example of this process is seen in the image to the right. In the top panels,
we subtracted off local backgrounds, where the background region is determined
in progressively smaller sizes (from left to right). At large sizes, big galaxies
are relatively untouched, while, at small sizes, the small galaxies appear on their
own. This is similar to à trous transforms, except the dual is
not uniform across the field (so you cannot add them up to get the original image).
Importantly, we took the difference of these images, shown in the bottom panels.
With this step, visible structure corresponds to the full extents of galaxies at those
scales. While we used more scales than the three shown here in the actual work, the method
nevertheless demonstrates the ability of this technique to let us detect the full sizes
of galaxies, even when they overlap.
An example of this process is seen in the image to the right. In the top panels,
we subtracted off local backgrounds, where the background region is determined
in progressively smaller sizes (from left to right). At large sizes, big galaxies
are relatively untouched, while, at small sizes, the small galaxies appear on their
own. This is similar to à trous transforms, except the dual is
not uniform across the field (so you cannot add them up to get the original image).
Importantly, we took the difference of these images, shown in the bottom panels.
With this step, visible structure corresponds to the full extents of galaxies at those
scales. While we used more scales than the three shown here in the actual work, the method
nevertheless demonstrates the ability of this technique to let us detect the full sizes
of galaxies, even when they overlap.
 Having made a good detection catalog, the next step is to use that
to get good photometry. The total light of a galaxy is contained in
a set of pixels; the value of those pixels is the light of the galaxy
plus the light of everything else. There are two ways, then, to go about
measuring the lights of galaxies -- assume you know the light of the galaxy,
or assume you know the light of everything else. The first type includes
parametric models of galaxy light profiles, while the latter is
focused on excellent background estimation. There's an inherent
bias when you want to do galaxy science using colors from modeled
light profiles, so we opted for option 2.
Having made a good detection catalog, the next step is to use that
to get good photometry. The total light of a galaxy is contained in
a set of pixels; the value of those pixels is the light of the galaxy
plus the light of everything else. There are two ways, then, to go about
measuring the lights of galaxies -- assume you know the light of the galaxy,
or assume you know the light of everything else. The first type includes
parametric models of galaxy light profiles, while the latter is
focused on excellent background estimation. There's an inherent
bias when you want to do galaxy science using colors from modeled
light profiles, so we opted for option 2.
 Our background estimation technique has a simple premise: the background
light for a pixel at the edge of a galaxy should be consistent with
the light of all the background pixels outside the galaxy. And,
since the background region can have other sources of light in it,
the best measurement of the "true" background is the mode. Finding
the mode for all but the simplest sets of data is inherently complicated,
and the precision of pixel values makes this even more difficult. Our
insight is that each pixel has a variance -- each time the background
was sampled during imaging, it was drawn from a background probability
distribution, and the variance on the same pixel is similar to the
expectated variance of the background. So take all the background pixels,
convolve them each with a unique Gaussian that has a variance equal to that pixel's
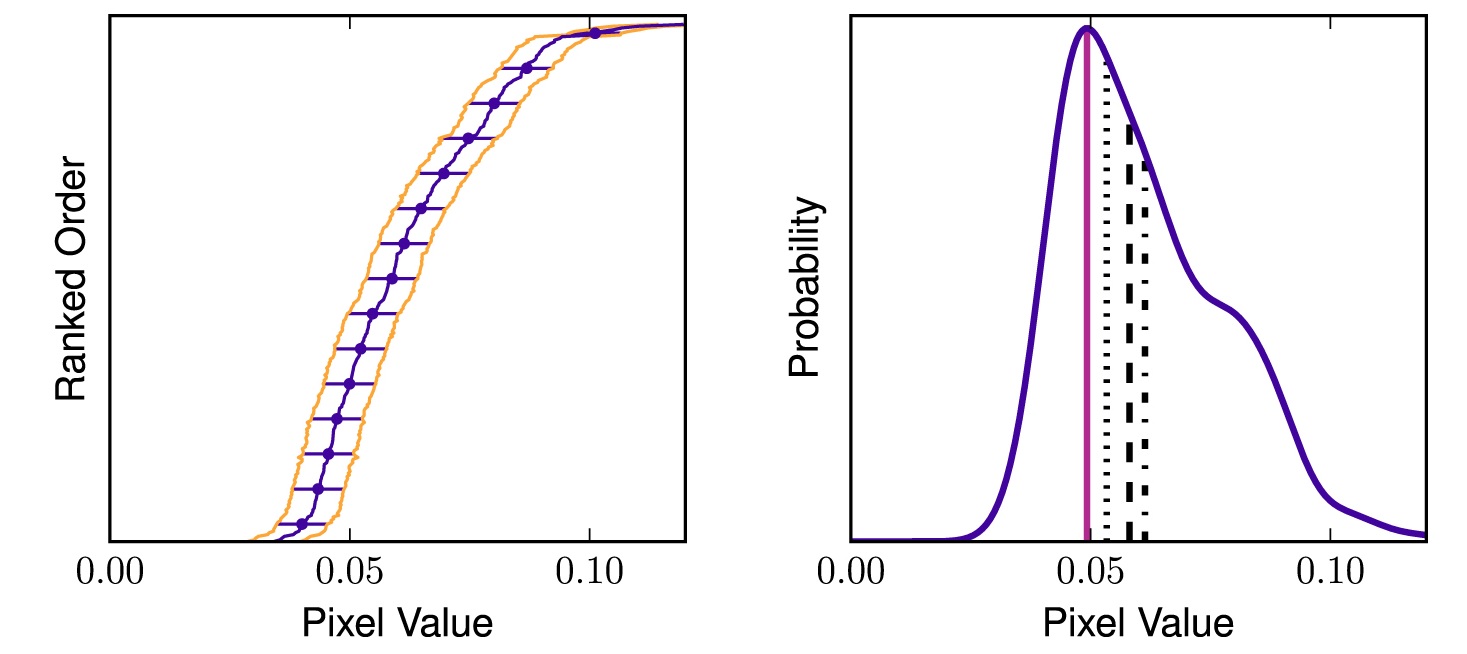
variance, and sum the distribution. The mode is the peak of that distribution.
This is shown on the right image; the left panel shows the nominal flux
values for a set of ordered pixels, and the spread is their variances.
Collapse that down, and you get the distribution on the right. The mean,
median, and other estimates of the mode are shown, but the TRUE mode is
found by our technique.
Our background estimation technique has a simple premise: the background
light for a pixel at the edge of a galaxy should be consistent with
the light of all the background pixels outside the galaxy. And,
since the background region can have other sources of light in it,
the best measurement of the "true" background is the mode. Finding
the mode for all but the simplest sets of data is inherently complicated,
and the precision of pixel values makes this even more difficult. Our
insight is that each pixel has a variance -- each time the background
was sampled during imaging, it was drawn from a background probability
distribution, and the variance on the same pixel is similar to the
expectated variance of the background. So take all the background pixels,
convolve them each with a unique Gaussian that has a variance equal to that pixel's
variance, and sum the distribution. The mode is the peak of that distribution.
This is shown on the right image; the left panel shows the nominal flux
values for a set of ordered pixels, and the spread is their variances.
Collapse that down, and you get the distribution on the right. The mean,
median, and other estimates of the mode are shown, but the TRUE mode is
found by our technique.
 Finally, we apply this background estimation technique to our galaxies.
Starting from the outside and working in, we compute a local background
for each pixel. In doing so, we also capture the variance of the
distribution, so that we can replace each pixel with its background
value and variance. Then, this pixel can be used to estimate the
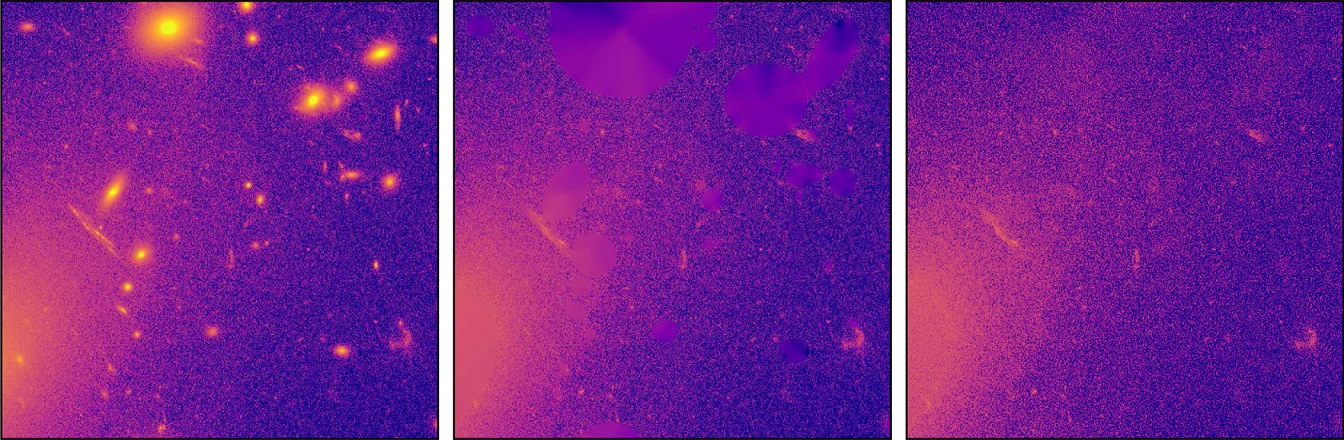
background of inner pixels as we work our way in. The process is
shown in the figure to the left. Galaxies are replaced from smallest
to largest, leaving the background light seen in the middle panel.
While this has a glassy appearance due to being near noisy background,
when we resample each pixel based on their variances, the extracted
galaxies have disappeared into the background light.
Finally, we apply this background estimation technique to our galaxies.
Starting from the outside and working in, we compute a local background
for each pixel. In doing so, we also capture the variance of the
distribution, so that we can replace each pixel with its background
value and variance. Then, this pixel can be used to estimate the
background of inner pixels as we work our way in. The process is
shown in the figure to the left. Galaxies are replaced from smallest
to largest, leaving the background light seen in the middle panel.
While this has a glassy appearance due to being near noisy background,
when we resample each pixel based on their variances, the extracted
galaxies have disappeared into the background light.
From this, we were able to assemble a fantastic catalog of cluster galaxies for CLASH. In addition to the science presented in the catalog paper, it has already been used by Burke-Spolaor et al. (2017) and DeMaio et al. (2018) . There's also some further work being done by our team, but those results are still not out yet.